21 Jun
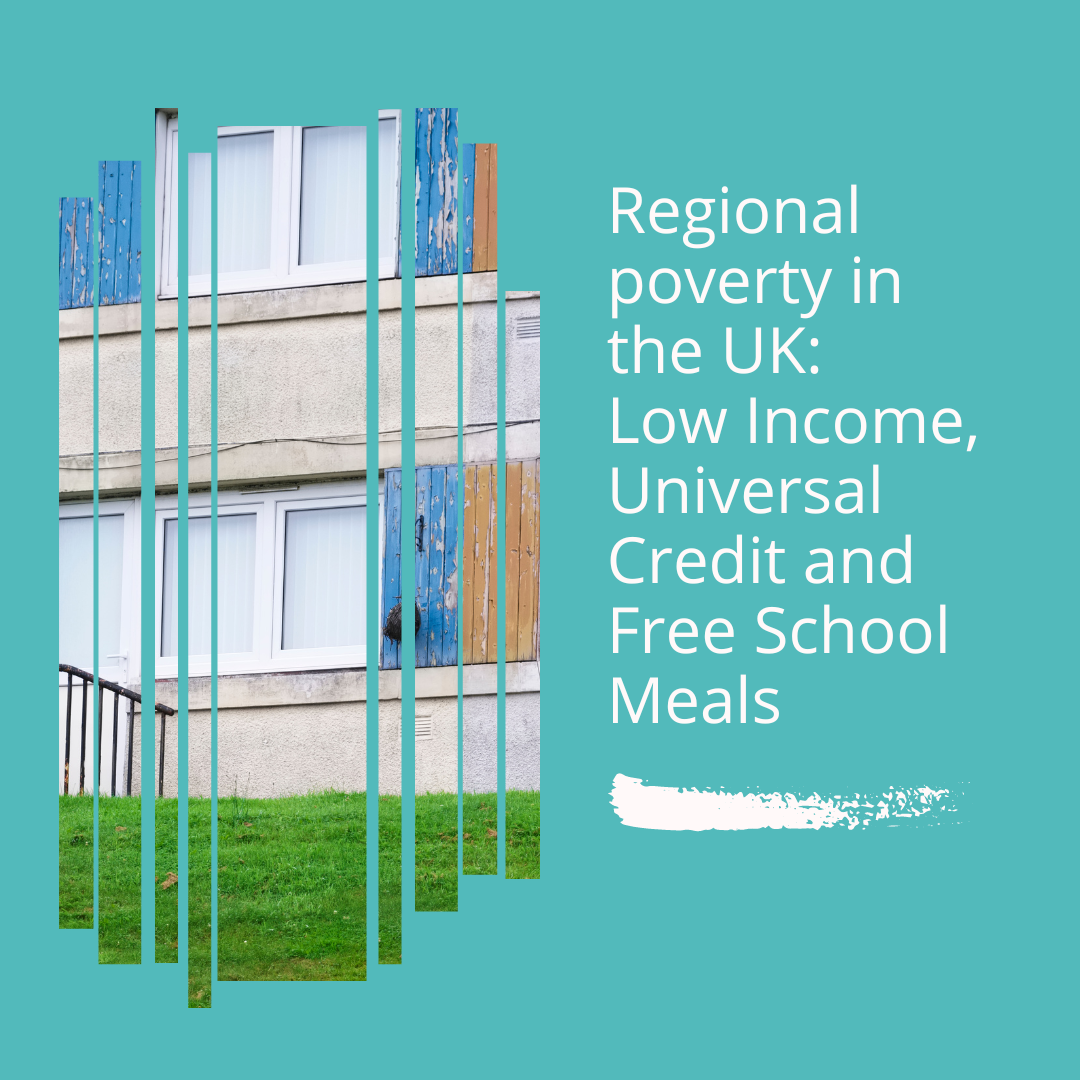
Regional poverty in the UK and how this has changed since 2020
After two extremely difficult years, the UK’s lowest-income households have been hit the hardest. The cost-of-living crisis is still hitting headlines and people’s purse strings are getting pulled even tighter. The entire world has been affected by global events such as Covid-19 and the Russia-Ukraine War, but the UK’s economy has certainly taken a hit. But how have the separate regions of the UK been affected financially? Which area currently has the lowest average income, the highest amount of Universal Credit users, and free school meals?
Overall lowest-income households and the pandemic aftermath
In early 2022, 29% of adults reported that their household could not afford an unexpected but necessary expense of £850. Overall, one in six people in the UK has a relatively low income before housing costs, which rises to one in five people after housing costs. Relative low income means that the household income is below 60% of the average household income that year.
After the pandemic, everyone faced a financial hit. However, some groups were hit harder than others.
- Low-paid workers were in jobs that were less likely to be able to work from home during
the lockdown. So, the lower-income households typically had members of the family who lost
their jobs or were furloughed. - Specifically, minority ethnic groups made up a larger than average proportion of the jobs in
sectors vulnerable to the coronavirus pandemic. - Single parents were more reliant on local jobs and more likely to have struggled with
childcare funds during the lockdown.
Poverty by region and country in the UK
Before housing costs, the West Midlands, Yorkshire and Humber, and the North East (all 21%) all contained the highest proportion of individuals with relatively low income. This was over the three-year period 2017/18 to 2019/20. After housing costs, the proportion was highest in London (27%).
In terms of salary, the lowest average income in the UK is in the following areas:
- Nottingham (£13,138)
- Leicester (£13, 269)
- Blackburn with Darwen (£13,741)
- Swansea (£15,755)
- South Teesside (£15,764)
- Liverpool (£15,848)
Clearly, the more northern urban areas of the UK have the lowest income. This could be for a variety of reasons including job opportunities in the City Centres and the higher typical salaries in the south of England, especially in London.
Regional Universal Credit Statistics
Collectively, 40,000 people in the UK make claims to Universal Credit per week. Of these 40,000, 33,000 start on Universal Credit per week.
At the time of April 2022, 5.6 million people were claiming Universal Credit, which was up 35,000 people from January 2022. In November 2021, the average monthly payment to households was £780. In February 2022, the average payment rose to £790.
Regionally, there was an increase in the percentage of people on Universal Credit that live in the West Midlands compared with 2021. The rest of the regions of the UK remained consistent with previous years. Currently, there is a higher percentage of people in London claiming Universal Credit, compared with other regions, followed next by the North West and South East.
Free School Meal statistics
In the 2020/21 academic year, over 1.74 million pupils were eligible for free school meals in England, compared with 1.44 million pupils in 2019/20. This means that 22.5% of pupils are eligible for free school meals, up from 20.8% in 2021. In terms of the regions, the highest eligibility rates are seen in the North East where 29.1% are eligible for free school meals. The regions which have shown the largest increase are London and West Midlands, with increases of 2 percentage points over the 2021 rates. This is vastly different from the 17.6% of pupils who are eligible for free school meals in the South East and 18.2% of pupils are eligible in the East of England. However, all regions show some form of increase from 2021.
How to help customers in these vulnerable areas
If you are a creditor and you also find that certain areas of residence of your customers highlight higher financial vulnerability, then it is time to act now. More people are becoming reliant on benefits and government assistance just to pay their bills and afford the essentials. By teaming up with IE Hub and using the online income and expenditure software, you will be able to easily identify your vulnerable customers and provide a less stressful way to assess what they can afford. As shown above, financial data of the UK and regionally is ever-changing and so IE Hub allows creditors to remain on top of any SFS guideline changes. To find out more, click here.
Even though the start of the pandemic was two years ago, its effects of it are still very much apparent. From the data, many areas of the UK have been affected financially and results show that some areas are continuing to struggle.
Has any of the data provided today surprised you, or do your own statistics say the same thing?